
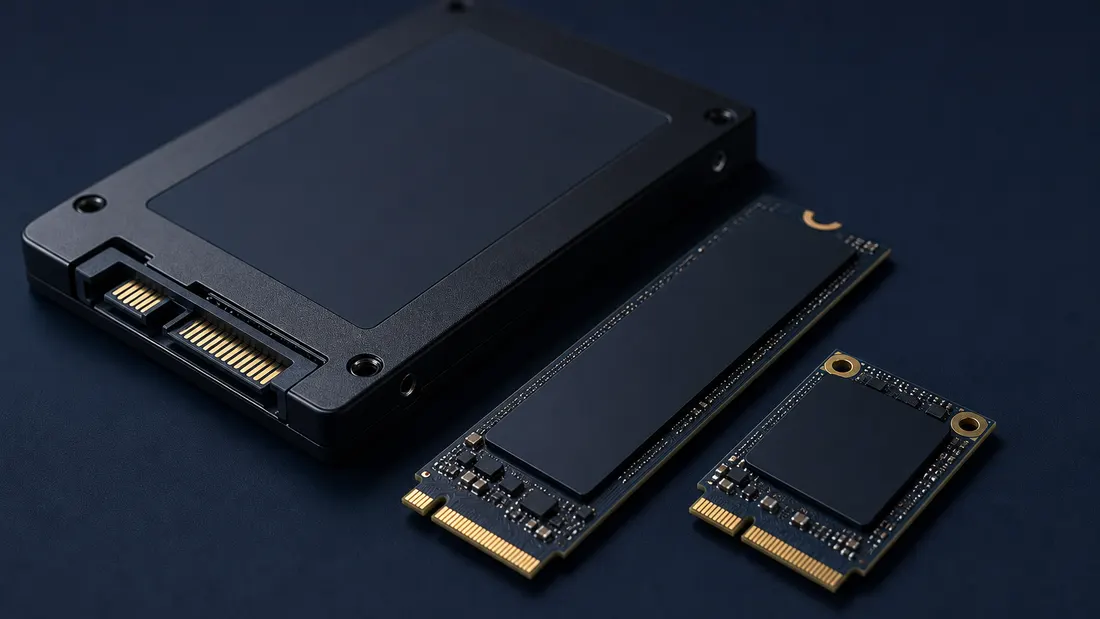
Kalstor industrial SSD guide: choosing SATA or NVMe from workload data
- Choose the interface from host compatibility and measured workload: SATA 6Gb/s has a stated 600MB/s transfer ceiling, while PCIe/NVMe offers a much higher link budget and queue scale.
- Convert daily host writes and service years into required TBW or DWPD before selecting capacity; interface speed does not determine endurance.
- Product approval needs sustained-state throughput and p99 latency after cache exhaustion, not only a short fresh-drive peak.
- Kalstor proposals are tied to an exact quoted configuration and evidence scope; controller, NAND, firmware, temperature grade and change control must be confirmed rather than inferred.
A Kalstor industrial SSD project should not begin with “SATA or NVMe?” It should begin with the host connector and protocol, daily writes, transfer sizes, latency deadline, temperature, power behavior and required supply-control period. Those inputs determine whether the product needs SATA compatibility, NVMe bandwidth, higher endurance, wide temperature, power-loss features or a controlled BOM.
A desktop review may show an NVMe SSD delivering hundreds of thousands of IOPS at queue depth 32, while an embedded product still pauses during boot or log rotation. Both observations can be true. The benchmark measured how much parallel work the drive could accept; the product may issue only one or two requests at a time and care more about the slowest completion than the total completed per second.
Queue depth is therefore not a decorative benchmark label. It describes how many input/output requests are outstanding at the device. To use it correctly, an engineer must connect protocol architecture, host concurrency and application deadlines.
What the Kalstor industrial SSD product program covers
Kalstor handles project-based SATA and NVMe SSD sourcing for embedded computers, edge equipment, recorders, industrial controllers and specialist distribution. Depending on the quoted SKU, the discussion can include 2.5-inch SATA, mSATA, M.2 SATA and M.2 NVMe formats, capacity, temperature grade, endurance, firmware and configuration-control terms.
This article is a selection framework, not a universal datasheet. It does not claim that every capacity, NAND type, temperature option or power-loss feature is always available. Kalstor confirms the exact configuration, current supply terms and evidence package after receiving the host, workload, capacity range, environment and forecast.
Current portfolio data: the fields Kalstor can publish
The table below reproduces the controlled fields in Kalstor's August 2026 SSD portfolio specification [9]. Sequential figures are catalog maxima for the listed family, not guaranteed sustained results for every capacity or workload.
| Kalstor product family | Dimensions | Capacity range | Interface and voltage | Catalog sequential read/write | Catalog random read/write |
|---|---|---|---|---|---|
| 2.5-inch SATA III | 100 × 69.85 × 7.0mm | 128GB-4TB | SATA 6Gb/s, 5V | up to 550/500MB/s | up to 80K/75K IOPS |
| mSATA | 50.8 × 29.85 × 4.0mm | 128GB-2TB | SATA III, 3.3V | up to 550/500MB/s | up to 80K/75K IOPS |
| M.2 SATA 2280 | 22 × 80 × 2.15mm | 128GB-4TB | SATA III, 3.3V | up to 560/520MB/s | up to 100K/80K IOPS |
| M.2 SATA 2242 | 22 × 42 × 2.15mm | 128GB-4TB | SATA III, 3.3V | up to 560/520MB/s | up to 100K/80K IOPS |
| M.2 NVMe 2280 | 22 × 80 × 2.15mm | 512GB-4TB | PCIe Gen3 x4 M-key, 3.3V | up to 2100/1700MB/s | Not released as a controlled public field |
The current common portfolio fields are TLC NAND, 0 to 70°C operating temperature, -25 to 85°C storage temperature, 0-95% stated humidity and 1500G/0.5ms shock. The 2.5-inch SATA line lists hardware power-loss protection; that feature must not be generalized to every form factor without the quoted SKU's datasheet.
On the 2.5-inch drive, the familiar connector edge contains two adjacent L-keyed sections. The shorter section has 7 contacts for SATA data; the wider section has 15 contacts for power, making 22 contacts in the combined device connector. They have different electrical functions even though they sit beside each other. An M.2 SATA module uses the SATA protocol through its M.2 edge connector and does not carry these separate 7-pin and 15-pin receptacles.
Several engineering fields remain deliberately open at article level: controller and NAND part numbers, firmware revision, TBW/DWPD, active and idle power, detailed SMART attributes, warranty conditions and capacity-specific steady-state results. They belong in the RFQ configuration sheet and approved sample record. Where legacy supplier narrative conflicts with its parameter table, Kalstor uses the table only as a candidate specification and requires a corrected model datasheet before release.
Start with the interface budget
SATA-IO states that SATA Revision 3.0 raised the interface transfer rate to 6Gb/s, described in its FAQ as up to 600MB/s [5]. This is an interface rate, not a promise that an SSD will sustain 600MB/s of user data. Protocol overhead, controller design, NAND, workload and thermal state reduce the application result.
PCI-SIG documents PCIe 3.0 at 8.0GT/s with 128b/130b encoding and approximately 1GB/s per lane per direction [6]. An x4 link therefore has an approximate 4GB/s one-direction link budget before higher-layer overhead. PCIe 4.0 doubles the signaling rate to 16GT/s, giving an approximate 8GB/s x4 budget [7]. The actual NVMe product remains limited by its controller, NAND channels, firmware, power and cooling.
| Interface | Published signaling basis | Approximate one-direction link budget | What the number does not prove |
|---|---|---|---|
| SATA Revision 3.0 | 6Gb/s | up to 600MB/s stated by SATA-IO | Sustained NAND write, low latency or endurance |
| PCIe 3.0 x2 | about 1GB/s per lane | about 2GB/s | That an x2 SSD reaches the full link rate |
| PCIe 3.0 x4 | about 1GB/s per lane | about 4GB/s | QD1 speed, thermal stability or firmware quality |
| PCIe 4.0 x4 | double PCIe 3.0 signaling | about 8GB/s | Sustained product throughput in an enclosure |
Choose SATA when the host is SATA-only, the measured workload fits the sustained product result and platform stability is the priority. Choose NVMe when the host exposes PCIe, the application has real bandwidth or concurrency demand, and the thermal/power design can support the selected module. A protocol converter does not automatically preserve boot behavior, SMART visibility, power states or recovery characteristics.
Convert the write workload into a product requirement
For a first endurance budget:
Required TBW = Host writes per day × 365 × service years ÷ 1,000
Workload DWPD = Host writes per day ÷ SSD capacity in GB
The following dataset assumes five years and adds a declared 30% engineering allowance to the arithmetic TBW. The allowance is an example policy, not an industry rule and not a Kalstor product rating.
| Host writes/day | Five-year host writes | With 30% allowance | DWPD on 512GB | DWPD on 1TB |
|---|---|---|---|---|
| 50GB | 91.3TB | 118.6TB | 0.10 | 0.05 |
| 150GB | 273.8TB | 355.9TB | 0.29 | 0.15 |
| 300GB | 547.5TB | 711.8TB | 0.59 | 0.30 |
| 600GB | 1,095.0TB | 1,423.5TB | 1.17 | 0.60 |
The selected drive's published TBW must use a compatible capacity, warranty period, workload definition and temperature scope. Host writes are not necessarily NAND writes: internal write amplification can make the flash program more data than the host submitted. A five-year arithmetic budget also does not prove five calendar years of data retention after power-off.
Increasing capacity can reduce workload DWPD because the same host writes are spread over more user capacity and potentially more flash. That benefit only applies if the product family scales endurance accordingly; confirm the exact datasheet rather than extrapolating.
Match the product to a measurable deployment
| Deployment | Measured data to collect | Likely product direction | Release evidence |
|---|---|---|---|
| Industrial HMI or controller | Boot QD1 latency, log writes/day, brownout behavior | SATA or low-power NVMe with controlled firmware | Boot cycles, p99 latency, power recovery |
| Multi-camera recorder | Aggregate MB/s, retention, simultaneous playback | High-endurance SATA or NVMe depending stream count | Sustained overwrite, temperature and file recovery |
| Edge AI appliance | Model/data load rate, scratch writes, queue concurrency | NVMe when PCIe bandwidth is used | Mixed workload, thermal steady state, health logs |
| Vehicle computer | Daily writes, vibration, supply transients, enclosure temperature | Qualified wide-temperature configuration subject to SKU | Host compatibility, environmental and power tests |
| Specialist resale | Customer host mix, claimed grade, return reasons | Clearly segmented SATA/NVMe product families | Identity, capacity, sample report and change terms |
“Industrial” is not created by changing a label. The proposal must identify which industrial requirements are actually covered: operating temperature, endurance rating, power-loss behavior, fixed configuration, longevity or change notification. If a field is not supported by the quoted SKU, it should remain an open requirement rather than become marketing copy.
What queue depth measures
If a host submits a read and waits for completion before submitting the next read, the device normally sees queue depth one. If several application threads, filesystem operations or virtual machines issue requests concurrently, the block layer can keep multiple commands outstanding. Queue depth then rises until the host, driver or device becomes the limiting stage.
Queue depth is not identical to thread count. One asynchronous worker can maintain several outstanding requests, while many synchronous threads may still produce a shallow device queue. It is also not fixed by the SSD: the application, operating system scheduler, driver, interface and controller all influence the observed value.
The distinction matters because NAND flash works in parallel across channels, dies and planes. A controller needs enough independent work to use that internal parallelism. Once the useful parallelism is occupied, additional requests mostly wait in line.
SATA NCQ: useful concurrency inside a narrower command model
Native Command Queuing allows a SATA device to accept multiple commands and choose an efficient execution order rather than completing strictly in arrival order. SATA-IO describes NCQ as a way for the drive to optimize the order in which read and write commands are executed [3]. The command-tag model provides 32 positions, which is why QD32 became a familiar SATA saturation point [4].
That capability is important: SATA is not limited to one request at a time. A competent SATA SSD can combine NCQ with its internal flash scheduling and achieve much higher throughput than its QD1 result.
However, the host communicates through a single SATA link and a much smaller command space than NVMe. A QD32 SATA benchmark is consequently a test near the protocol's available command concurrency, not proof that a target application will maintain 32 useful outstanding operations.
NVMe: many queue pairs built for parallel hosts
NVMe defines submission queues into which the host places commands and completion queues through which the controller reports results. The base specification permits up to 65,535 I/O submission queues and 65,535 I/O completion queues, with up to 65,535 entries per queue subject to implementation and negotiated limits [1]. These are architectural maxima, not a promise that every SSD or operating system exposes them.
Multiple queue pairs let operating systems map work to CPU cores and reduce shared-lock contention. Doorbells and completion processing are designed for a PCIe-attached nonvolatile-memory device rather than adapted from a disk-era command path [2]. This gives NVMe a much higher ceiling for parallel workloads.
It does not eliminate latency. A request can still wait in the host scheduler, the NVMe submission queue, controller firmware, flash translation layer or NAND operation. Thermal throttling, garbage collection and power-state transitions can add further delay. The interface architecture explains opportunity; it does not replace measurement.
Why QD32 throughput can mislead a low-concurrency product
Imagine two drives tested with 4KiB random reads:
| Device | QD1 throughput | QD32 throughput | QD1 average latency | QD32 p99 latency |
|---|---|---|---|---|
| Drive A | 15k IOPS | 300k IOPS | 66 microseconds | 900 microseconds |
| Drive B | 13k IOPS | 220k IOPS | 77 microseconds | 420 microseconds |
These figures are a hypothetical teaching example, not product data. Drive A wins the saturation-throughput column. Drive B has the lower listed tail latency under the heavy queue. A boot workload that rarely exceeds QD2 may see little benefit from Drive A's QD32 ceiling, while a database with many independent workers may strongly prefer it.
The same table also shows why one result cannot define “faster.” Throughput asks how much work finishes per unit time. Latency asks how long an individual request takes. At high queue depth, throughput can rise while each request waits longer.
Use Little's Law as a consistency check
For a stable system, a useful approximation is:
Outstanding I/O ≈ IOPS × average latency in seconds
If a benchmark reports 80,000 IOPS with 100 microseconds average latency, the implied average outstanding work is:
80,000 × 0.0001 = 8 requests
If it reports 500,000 IOPS at 200 microseconds, the implied value is about 100 requests. This arithmetic does not prove the benchmark is correct, because measurement boundaries and batching matter, but it is an excellent plausibility check. A claimed IOPS value, latency value and queue configuration should describe the same system.
Little's Law also clarifies why lower latency can produce useful throughput without a deep queue. Cutting service time allows each queue position to turn over more often. Conversely, adding outstanding requests can conceal long service time behind concurrency while worsening application response.
Match queue depth to the application
Typical queue behavior differs by system:
| Workload | Likely concern | First tests to run |
|---|---|---|
| OS boot and application launch | Short bursts, dependencies between reads | QD1 and QD2 random/read-heavy latency |
| PLC, HMI or edge logger | Deadline misses during periodic writes | p99/p99.9 latency at realistic mixed load |
| Single-camera recorder | Sustained sequential write with metadata | QD1/QD2 write stability and flush latency |
| Multi-camera NVR | Parallel sequential streams plus playback | Aggregate throughput and tail latency at measured concurrency |
| Database or virtualization host | Many independent requests | Scaling curve across QD1, 4, 8, 16, 32 and beyond |
Do not assume these labels determine the queue automatically. Trace the target system where possible. On Linux, block-layer statistics, application telemetry and workload generators can reveal the number of outstanding requests. On an RTOS or custom controller, instrument command submission and completion timestamps.
The objective is a distribution, not one average. Record median, p95, p99 and, where the test duration supports it, p99.9 latency. Also count deadline violations. A 10-millisecond outlier may disappear inside an average yet still freeze a user interface or overflow a real-time buffer.
Build a reproducible SATA-versus-NVMe test matrix
Start with the product workload, then add diagnostic tests that isolate causes. A practical matrix includes:
| Variable | Minimum useful coverage |
|---|---|
| Block size | 4KiB random and the application's real transfer sizes |
| Read/write mix | 100% read, 100% write and the measured mixed ratio |
| Queue depth | 1, 2, 4, 8 and 32; higher only when the product can generate it |
| Workers | One synchronous path, then realistic application concurrency |
| Device state | Fresh reference plus preconditioned steady state |
| Fill level | Product release level and a high-fill condition |
| Duration | Long enough to cross cache exhaustion and background-management periods |
| Temperature | Controlled ambient with controller temperature logged |
Use incompressible or representative data when controller behavior may depend on data patterns. Hold the filesystem, OS, power policy and test platform constant. Report whether the test used raw block access or a filesystem. A filesystem test includes allocation, journaling and flush behavior that a raw benchmark may omit.
For write tests, continue beyond the SLC cache burst and observe recovery. For NVMe, log controller temperature and check for thermal throttling. Otherwise, a short cool-drive result may be compared with a long thermally limited run.
Separate interface effects from drive design
NVMe over PCIe offers more bandwidth, lower protocol overhead and much greater queue scalability than SATA. Yet a weak NVMe implementation can lose a low-queue or sustained-write test to a well-designed SATA SSD. NAND generation, channel count, DRAM or DRAM-less mapping, firmware, over-provisioning and garbage-collection policy still matter.
Form factor is separate again. M.2 describes a physical module, while SATA and NVMe describe interfaces and command models. The SSD form-factor and interface guide prevents an M.2 SATA module from being mistaken for an NVMe module.
For industrial selection, ask whether the specification is fixed across the order window. A benchmark on one controller and NAND combination does not qualify an unannounced replacement. The industrial-versus-consumer SSD guide explains how BOM control and change notification affect that decision.
Evidence to request before approval
A useful supplier or internal test report should identify:
- exact part number, capacity, firmware and hardware configuration;
- host platform, link generation, lane width, driver and power settings;
- workload tool and version, block size, data pattern and read/write ratio;
- queue depth, worker count and whether depth is per worker or total;
- preconditioning, fill percentage, test duration and ambient temperature;
- IOPS or bandwidth together with average and percentile latency;
- sustained-state graph, error count, temperature and throttling status.
Then run a target-host test. Reproduce the application's concurrency, verify boot and recovery paths, and place background writes beside foreground reads. For Kalstor qualification, the actionable input is not “need a fast SSD.” It is the host interface, workload trace or matrix, latency deadline, temperature, capacity, endurance target and required configuration-control period.
Bottom line
SATA NCQ and NVMe queues both expose storage concurrency, but they operate at very different architectural scales. QD32 is useful for finding saturation; it is not a universal model of product behavior. Measure QD1 and low-depth latency for dependent or interactive work, measure scaling where parallelism is real, and keep tail latency beside throughput. That produces an SSD comparison an engineer can reproduce and a buyer can defend.
FAQ
Does every industrial system need an NVMe SSD?
Why do SSD benchmarks often use QD32?
Which latency percentile should an industrial system specify?
Can I compare two vendor data sheets using IOPS alone?
Does Kalstor keep every SSD configuration in stock?
References
- NVM Express — NVM Express Base Specification 2.0a ↩
- NVM Express — NVM Express over PCIe Transport Specification 1.0 ↩
- SATA-IO — Native Command Queuing overview ↩
- SATA-IO — SATA 3.2 NCQ feature-set clarification ↩
- SATA-IO — SATA Revision 3.0 transfer-rate FAQ ↩
- PCI-SIG — PCI Express 3.0 bit rate and bandwidth FAQ ↩
- PCI-SIG — PCI Express 4.0 16GT/s FAQ ↩
- fio — official workload, verification and latency-percentile documentation ↩
- Kalstor — current product catalog and SSD portfolio fields ↩
We publish measured usable capacity and welcome trial-batch verification — automotive-grade, direct from the source factory.